
- Lead: Giovanna Ceserani
- Start Date: 2008
- Team:
Sarah Murray, 2008
Molly Taylor, 2008-2011
James Wood, 2010 - Project Website:
grandtour.stanford.edu
Grand Tour Travelers
Source: A Dictionary of British and Irish Travellers in Italy, 1701-1800, ed. John Ingamells from the Brinsley Ford Archive (New Haven: Yale University Press, 1997)
Correspondences made the Republic of Letters, in that they provided avenues for the exchange of information while constituting the Republic's social networks. But how did individual travelers, within or beyond its borders, affect the working of the Republic of Letters? To address this issue we chose to focus on a case study, that of the British, and Irish, Grand Tourists who visited Italy in the eighteenth century. Our choice was determined by the existence of a tremendous resource: A Dictionary of British and Irish Travellers in Italy, 1701-1800 [1997], which resulted from the work and archive of Sir Brinsley Ford and others at the Paul Mellon Center. We are well aware that the information provided by the Dictionary is in no way complete: we can assume that not all travelers are recorded, of course, and the completeness of the entries is somewhat variable. However, the Dictionary provides an unparalleled data-set for circa 6000 Grand Tourists and the opportunity to create a critical mass of data that allows us to look at some broader problems.
Text to Data
Since we began our project in 2008, we have been wrestling with the complex process of transforming a rich, nuanced set of historical information into a coherent dataset. Our challenge is to harvest the gappy, uncertain, and contingent information at our disposal in a way that simultaneously retains its complexities and gives us data in a format that machines can work with. The Ingamells dictionary is full of idiosyncracies. We often know very little about an individual besides a last name and a sighting in Venice sometime between April of 1712 and July of 1713. Perhaps we know that traveler X probably had dinner with another traveler in Florence around Christmas of 1780. He were certainly involved in a punch-up at a social gathering in Naples. And so on. How do we express these kinds of events in a database? The digitized Ingamells dictionary is huge, containing thousands and thousands of pieces of information, so we must make our decisions about data with care, since each repurposing of the database can require hours and hours of labor to implement.

How is the Project Spatial
Geographical Space
Our Grand Tour Data is, in many ways, a pure geodatabase, insofar as every event and person we have recorded has geographical data (albeit at a variety of resolutions) associated with it. The core of our database is the information about where in Italy various individuals appear in Italy during the course of the 18th century, and it was the richness of this geographical information that inspired us to attempt to visualize the Ingamells dictionary in the first place. We began with questions that were literally about collisions in space: when did people encounter each other physically during the 18th century? How did travel and correspondence intertwine to generate Enlightenment intellectual and social networks? These geographical questions drove our early visualizations:
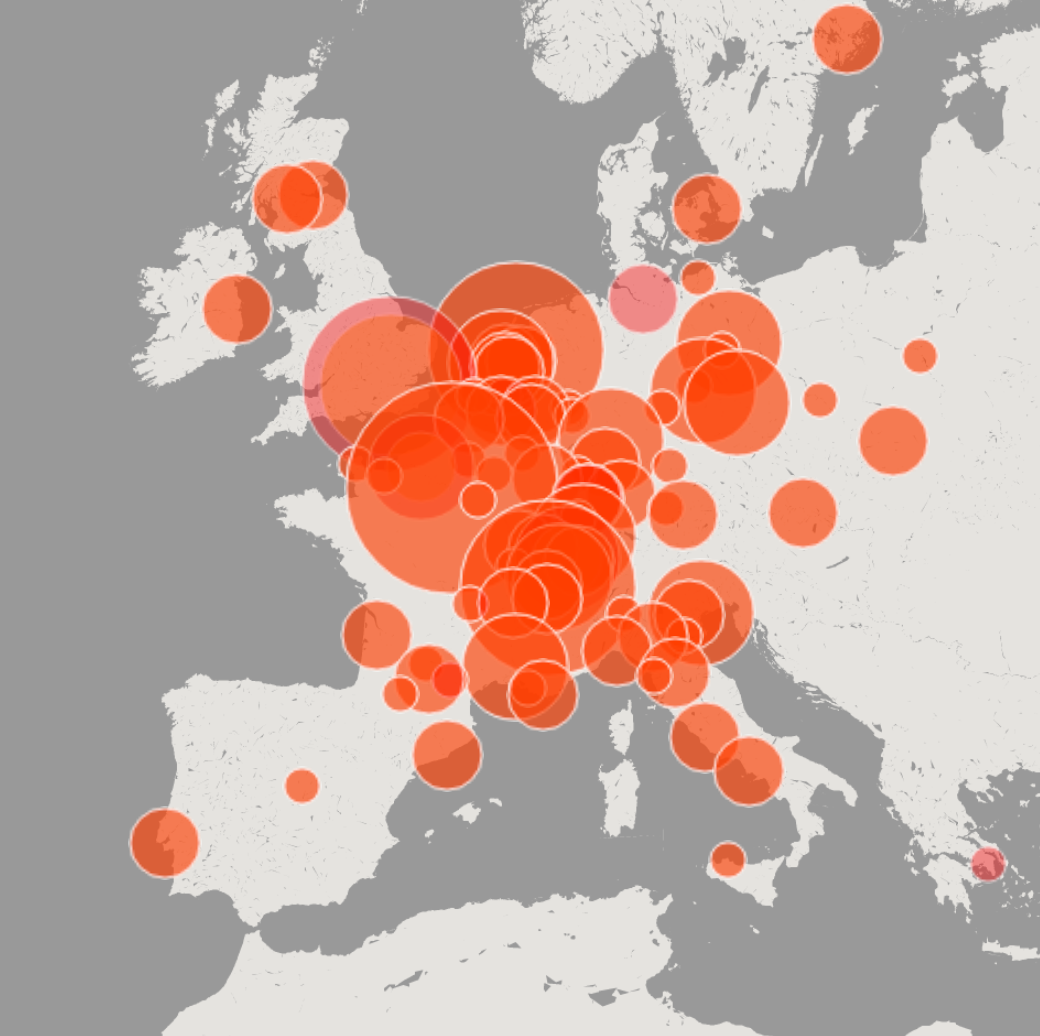
City Plots: Which Italian cities were most visited by British travelers in the 18th century? This is a very basic question, but one that could not be answered without a large dataset like the one we built. Even though Ingamells’ dictionary is not comprehensive, it is large enough that it should be expected to provide a representative sample of relative city popularity.

Jesse Kriss: When in Rome: How did the destinations of travelers compare? Working with data designer Jesse Kriss, we developed visualizations that allowed us to compare the order of cities visited from one Grand Tourist to the next.

Geography at a Glance: What patterns can we see in the geography of someone’s tour? Did they travel to the usual cities, branch out to all corners of Italy, or stick with a particular region? Our “Grand Tour at a Glance” provided a search enabled location plot, so a user could see a quick summary of the geographical purview of a particular research subject.

Route Maps: How did people get around from place to place? Did they go by land or by sea, take old Roman roads or cut across the countryside? Did travel (and by proxy communication) increase in ease and swiftness though time as progress and technology marched forward over the course of the 1700s? These are questions we sought to answer using the spatial and temporal data that we have generated in our project. We georectified 18th century maps in order to assess the likely routes that travelers may have taken, and produced route maps for individual travelers according to contemporary routes and conditions.
One particular case study looked in detail at travel to Sicily, since this is a region that is grew more popular/open to travelers over time. Our researchers engaged with primary sources (journals and letters written by travelers) in order to chart the nature and conditions of travel within Sicily. The maps produced show that infrastructure and knowledge networks grew over time in ways that fundamentally altered the experience of Southern Italian travel.

Temporal Space
While our data is about movement in space, it is also about the nexus between time and space. Because our dataset is so rich, our attempts to represent our data in “real” geography often ended up being muddled and confused. While mapping individual travel in places like Sicily produced compelling results, we simply had too much data for patterns in the data to be effectively clarified by geographical mapping on the scale of the entire dataset. We therefore sought different kinds of space through which to explore our data.
As a result, we developed a visual tool inspired by Joseph Priestley's Chart of Biography (1765). This timeline revolutionized the way that students learned about history and "accelerated understanding of historic patterns."

Using Priestley’s Chart as a notional prototype, we built an interactive timeline of Grand Tourists. This tool quickly contextualizes the information about individual travelers, while also showing us “big” patterns in the data at a glance.
On our timeline is organized by city. In the view for each city, a single colored bar represents every traveler known to have visited that city. Each traveler’s bar extends for the amount of time that he/she was known to have present in the given city. The timeline has two registers – the upper register shows an extent of time that is chosen by the user, while the bottom register shows the whole 18th century, and keeps the user informed about which portion of time is currently on view in the upper register. The area shown in the upper register can be expanded or contracted according to user choice, and can also be scrubbed along the timeline for ease of temporal navigation. The timeline is text-searchable, and clicking on each bar on the timeline provides the user with more information about the traveler represented by that bar, with an option to view their original Dictionary entry.
Social Space
In addition to temporal and geographical space, we have investigated the social spaces made up by the Grand Tour. In the end, the Grand Tour was all about people, and the relationships that developed and flourished among the Englishmen in Italy during the 18th century, and we are very much interested in the nature of human geography during this crucial period of intellectual history.
Charles Burney: One way to approach social space is through the lens of a particular traveler. Our research into social networks on the Grand Tour has so far been focused on Charles Burney, a composer. Burney made many connections during his trips to Italy during the 18th century, and the social networks he developed in different cities developed along with his career in ways that enlighten the nature of the musical profession as it existed in our period.

The Unconnected Network: We also took a look at Grand Tour relational space through a coarser periscope. We experimented with a view showing all of travelers who were associated with a city as dots. Then we showed connections that existed among travelers to a single city, whether they be due to correspondence, familial, or incidental relationships. This allows us to explore the space of the Grand Tour in a completely new way, which never would have been possible using traditional methods.

Related
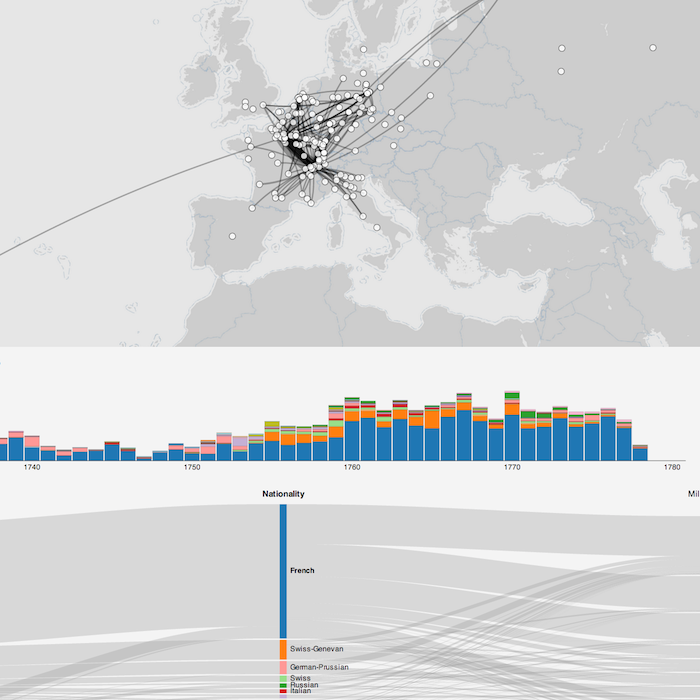
Voltaire's Correspondence
View an instance of Ink loaded with Voltaire's correspondence. In combines mapped letters with a timeline stacked bar chart and a relationship viewer.
Voltaire's Publications
Mapping Voltaire's publications with data from the BNF.
Humanities+Design
Visit the laboratory web site to learn more about the visualizations.